Uptime Toolbox integration for your own
personal dashboard or intranet 
adenin puts Uptime Toolbox data and all your other apps into a personal dashboard. Work smarter and interact, create, or embed your apps anywhich way you want.
This app provides users with website monitoring and lets you create your own status page. Particularly popular with Linux server users, Uptime Toolbox is a great tool for developers.
You can receive updates about your sites directly on your personal dashboard using the below Zap template. This means you don't have to check your inbox for down notifications and can easily spot and access problematic servers on Uptime Toolbox.
Make your own Adaptive Cards from Uptime Toolbox data
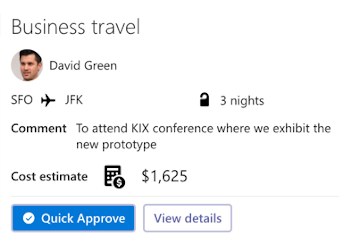
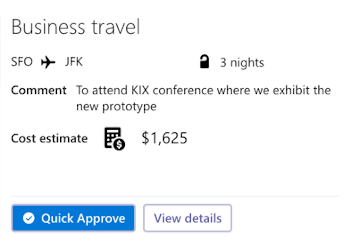
Once you connect the Uptime Toolbox API to your adenin account, a Card with your desired data will be generated and added to your dashboard.
Making changes to this Card’s layout is easy with our low-code Adaptive Card designer. Simply click on the ··· button and then Edit in Designer.
It’s incredibly developer-friendly and lets you drag-and-drop new elements into your design, or adjust the visual properties by selecting any element from the preview area.


How to install the Uptime Toolbox integration on your personal dashboard
Click the Add button below. This will open the Uptime Toolbox template in Zapier, a free service that sends Cards from over 5000+ apps to adenin.
Add Uptime Toolbox to adenin
In Zapier, select your Uptime Toolbox data source and authenticate with the app.

Then map the values to the Adaptive Card designer step of your Zap. As a title enter something like My Uptime Toolbox card as this is how it will appear on your dashboard.

Once your Zap is up and running, a Card with your Uptime Toolbox data will automatically appear on your personal dashboard. Everytime your Uptime Toolbox trigger fires in the future, this will add a new entry to that card.


