Power BI integration for your own
personal dashboard or intranet
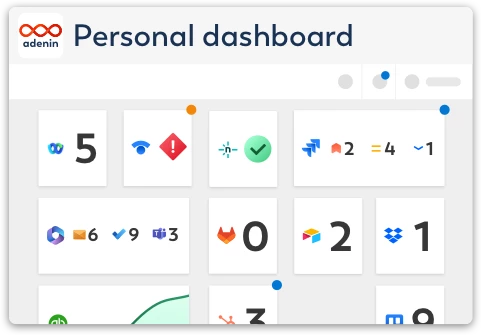
adenin puts Power BI data and all your other apps into a personal dashboard. Work smarter and interact, create, or embed your apps anywhich way you want.
Empower data-driven decision-making with the Power BI integration. This integration enables you to access interactive reports, analyze key metrics, and visualize data insights directly within your digital workplace. With Power BI’s advanced analytics and real-time dashboards, your team can monitor performance, share insights, and make informed decisions faster and more effectively.
Key Features and Benefits
- Real-Time Data Dashboards: Access live dashboards with real-time data updates to stay current on critical business metrics and performance indicators.
- Customizable Reports: Create and view customized reports that highlight the data most relevant to your team, enhancing visibility and focus on key areas.
- Data Visualization: Utilize Power BI’s robust visualization tools, including charts, graphs, and heatmaps, to interpret complex data at a glance.
- Collaboration on Insights: Share reports and collaborate on data insights within your team, supporting better decision-making and strategic alignment.
- Automated Alerts: Set up data alerts to notify you when metrics reach specific thresholds, ensuring prompt attention to important changes or trends.
- Seamless Data Integration: Integrate data from multiple sources like Excel, SQL databases, and third-party applications for comprehensive analytics.
- Cross-Platform Access: Access Power BI reports from desktop or mobile, making it easy to stay connected to insights from anywhere.
With the Power BI integration, enhance your team’s analytics capabilities, foster collaboration on data, and drive strategic outcomes with actionable insights—all within your digital workplace.
Make your own Adaptive Cards from Power BI data
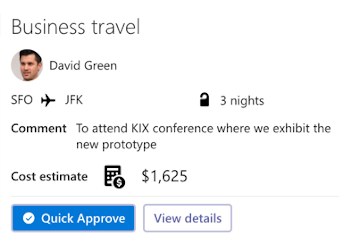
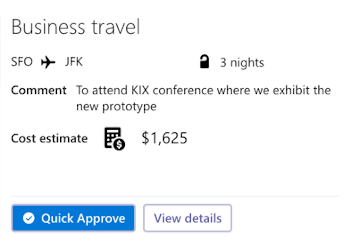
Once you connect the Power BI API to your adenin account, a Card with your desired data will be generated and added to your dashboard.
Making changes to this Card’s layout is easy with our low-code Adaptive Card designer. Simply click on the ··· button and then Edit in Designer.
It’s incredibly developer-friendly and lets you drag-and-drop new elements into your design, or adjust the visual properties by selecting any element from the preview area.


Available data sources
The Power BI connector API provides this endpoint:
How to install the Power BI integration on your personal dashboard
Click the Add button below
Add Power BI to adenin
Either log in or create your free adenin account. Then you will be directed to your personal dashboard where the installation of your Power BI integration will start.
Follow the steps in the modal by clicking Next including selecting your data source, authorizing your Power BI account and more attributes (if they are required).
At the end click Finish and our built-in smart technology generates a Card with the live data it received from the Power BI API.
Power BI
Your Card will now appear on your adenin dashboard.
Modify or embed your Adaptive Card from the ··· button in the top right-hand corner of your card:
Click Edit in Designer to open the Card’s layout in the low-code Adaptive Card designer.
By clicking Share you can see options for embedding your Card into intranet and chatbot channels. For example, your Power BI integration works as a SharePoint web part, or with chatbots such as Microsoft Teams.

